The Ireland Air Quality Leaderboard
What does it do?
The Environmental Protection Agency runs a collection of air quality sensors in towns across Ireland. The data they collect is
updated every hour or so and we look at that information and keep track of what is going on. You can look in more detail at the sensor network and what it monitors
on the EPA run
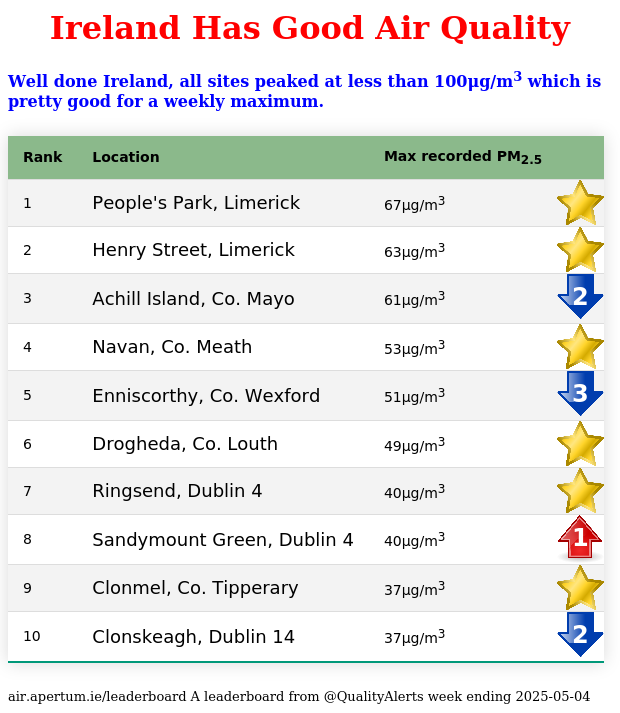
air quality website. Every week we look at the highest value of PM
2.5 for each sensor
over the course of the last full week and produce a leaderboard ranking the locations with the highest numbers and showing a top 10. We compare this with last week and show which ones are going
up

,
down

,
new

,
or equal

,
to their
previous position.
Are the sensors accurate?
Yes - generally. They are very expensive high quality scientific instruments, the values have been cross checked with low cost sensors and when the EPA sensors report
high values it will tend to be on still, cold nights when people are burning coal and turf. If they are reporting values over 100 then it will be noticeably smokey.
It is possible that a single reading will be spurious, maybe someone sitting by the sensor having a smoke, perhaps just a weird error.
The EPA have a
disclaimer on the data that specifically advises that sharp spikes should be treated with caution.
We are throwing caution to the wind and using them anyway, so do bear that in mind.
What causes pollution? Is it traffic or dirty industry?
It is solid fuel burned for domestic heating in open fires and stoves. The
SAPPHIRE project studied the composition of air pollutants
and attributed a large proportion to peat, wood and coal. Traffic is about 1% (less than sea salt) and only domestic heating leads to the extreme evening accumulations that generate levels
of particulates that are a concern for health. Whilst traffic and industry do produce pollution (and CO
2 which is a concern globally) they don't appear to be a significant contributor to localised
daily pollution of levels that are a concern for public health.
There are other polution sources, but if your town is on the leaderboard it is because of domestic heating choices.
Can we do anything about it?
Yes, we could. Switch to cleaner heating sources, especially on cold still nights. The cleaner heat sources include district heating,
electric heat pumps, electric resistive heating, bioethanol, gas and oil. Solid fuels like smokeless coal, bitumous coal, turf, briquetts,
lignite, wood (dry or wet) burned in an open fire or eco stove are all bad.
On a public policy level the government could provide financial incentives for switching to cleaner heating sources.
What should I do if my town is on the leaderboard?
You might want to consider following the
EPA advice relating to reducing physical activity and if you were thinking
about lighting the fire you could use an electric heater instead. To make a real difference it is going to take concerted
local action. Let people know that they can make a difference and share the leaderboard locally.
Why is the number reported in the leaderboard not seen on the graph?
We look at the values reported as the latest reading. The graph shows hourly averages and possibly readings could be
corrected after they were initially reported. We could just be wrong or we may have missed some of the data. We try to get it right,
but don't take it too seriously!
Is there a more accessible version?
Yes,
over here.